With the continuous advancement of tissue staining techniques, it is now possible to detect multiple protein and/or RNA signals on a single tissue section. These biological signals have labeled and visualized the distribution characteristics of different functional cells. Furthermore, it is challenge to analyze the image information and data mining to understand the spatial distribution characteristics of specific cells, to explore certain cell type interactions with surrounding tissues and cells, to correlate the image data of sample with its biology background or clinical information (e.g., having received different treatments and showing different therapeutic effects).
The image analysis team and bioinformatics analysis team at PhenoVision Bio have over a decade of accumulated experience in image analysis and in-depth data mining in the area. By introducing Visiopharm’s leading image analysis AI algorithms, combined with pathology level of image reading, PhenoVision image analysis team have developed the "Pheno Whole Slide Analysis (PWSA) Platform." This platform enables pathology-level image analysis and in-depth data mining based on multiple stained images. It therefore uncovers the rich data information from whole slide scanned images and allows for a deep interpretation of the tissue microenvironment and spatial biology information, including but not limited to the identification and quantification of various cell phenotypes, distribution of different phenotypic cells, spatial distance relationships between tumor cells and immune cells, and the impact of immune checkpoints on the tumor immune microenvironment.
1. A sound quality control system is the foundation for ensuring the credibility of quantitative analysis.
Phenoision Bio has established a quality control system that encompasses processes such as sample preparation, staining, imaging, and data analysis, ensuring stable and accurate results.
2. Precise cell identification is the core of accurate quantitative analysis.
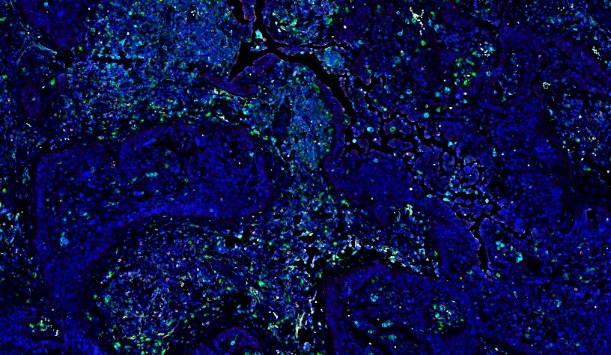
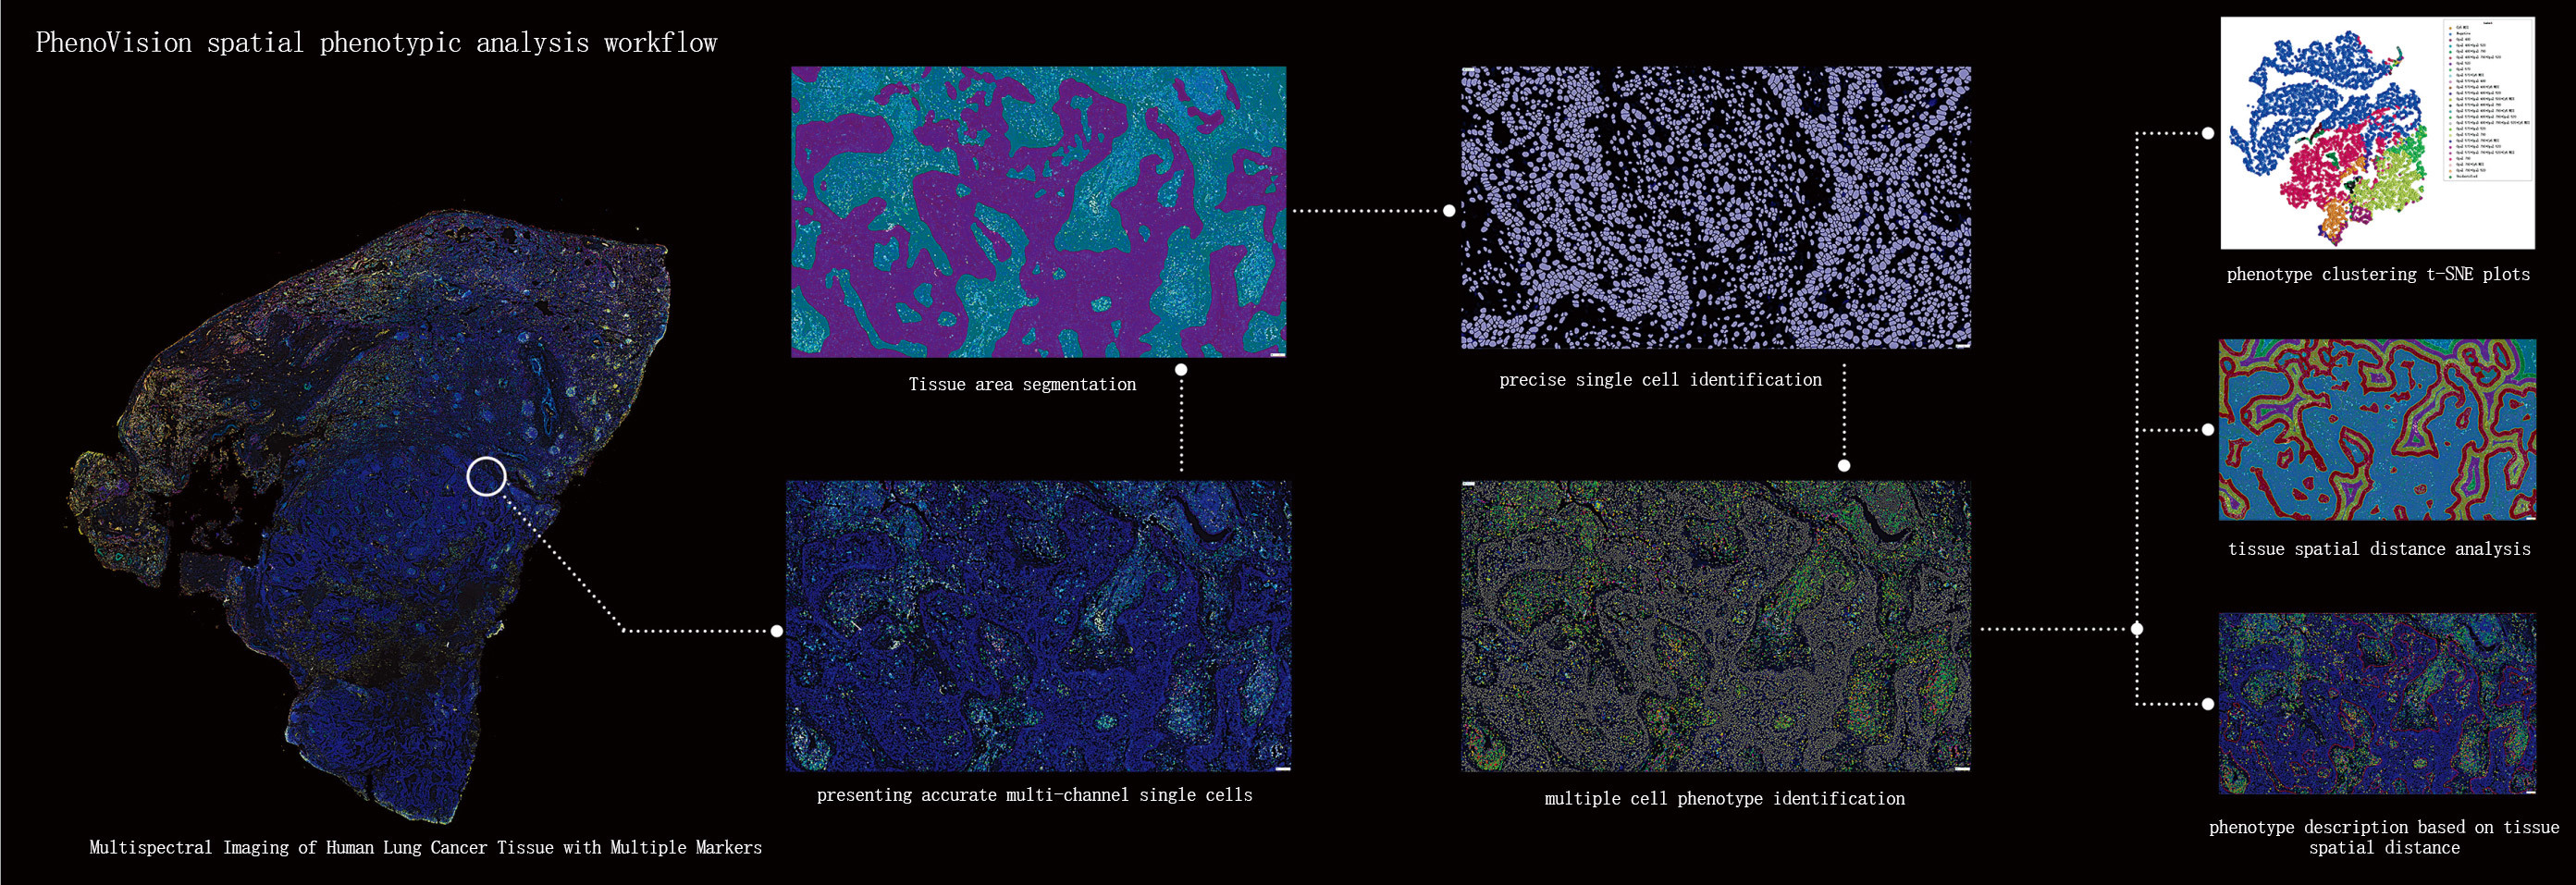
In tissue section samples, various types of cells are intermingled, with significant differences in morphology, size, and staining. The PWSA platform, based on deep learning algorithms, can accurately identify cells of different sizes and diverse morphologies simultaneously.
3.Analyzing panoramic digital slides is the foundation for obtaining comprehensive and objective in situ data.
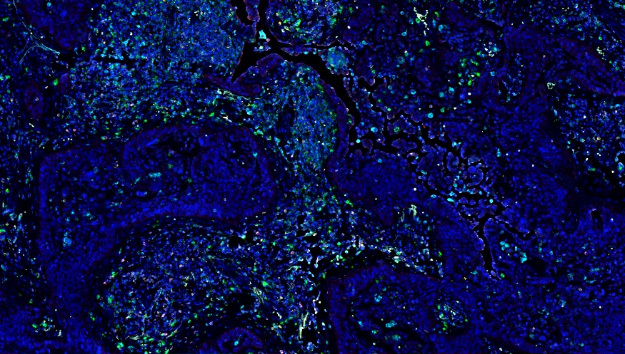
The PWSA platform performs a comprehensive analysis of the digital information of the entire stained slide, obtaining comprehensive, objective, and precise data on protein expression and cell phenotype distribution across the entire tissue section. This assists researchers/doctors in making evaluations and diagnoses, thereby saving time and effort.
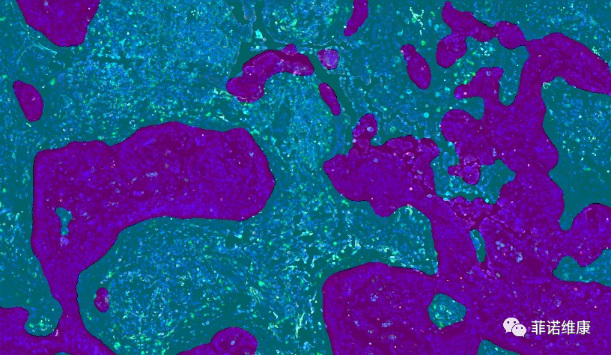
4. Tissue segmentation and spatial analysis are important tools for in-depth investigation of the tissue microenvironment.
The PWSA platform performs training for tissue type segmentation across multiple slide images, thereby obtaining comprehensive information about the target tissue. This enables precise tissue segmentation and quantification. Combined with cell phenotyping, it can be used for studies such as immune cell infiltration in tumor tissues.
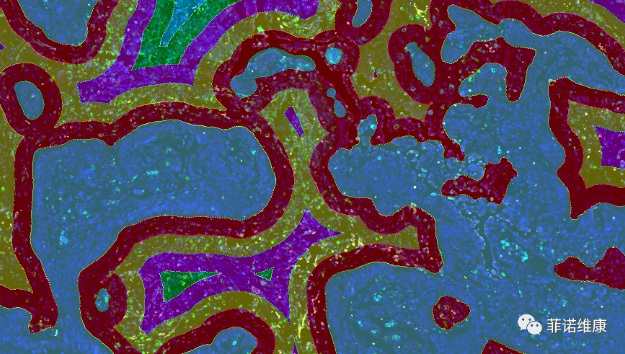
5. Distance Analysis Between Specific Tissues and Cells
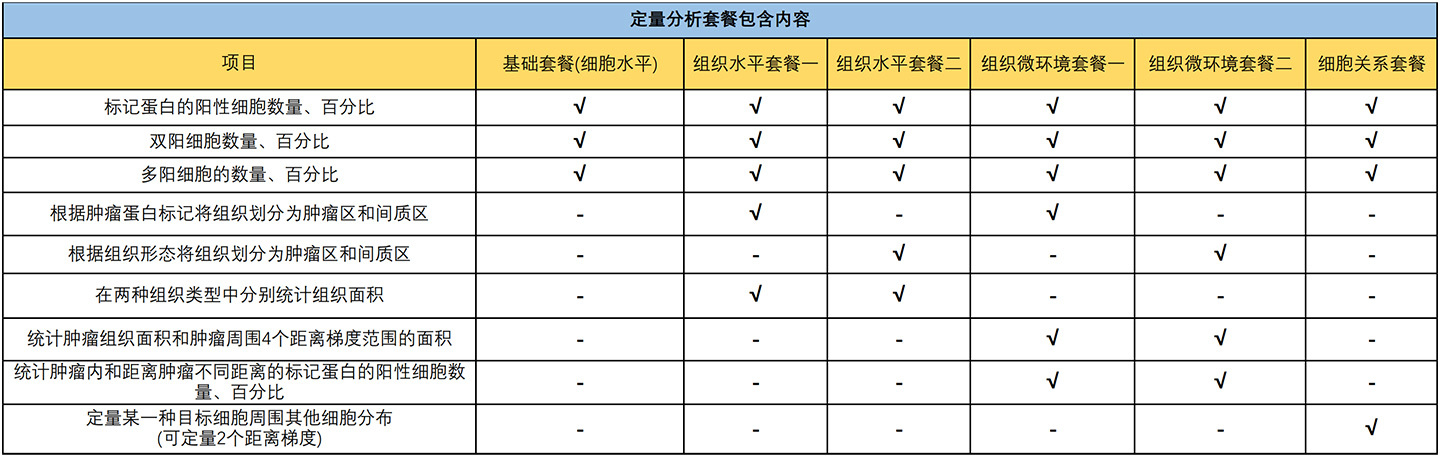
With the emergence and development of spatial multi-omics, simply quantifying cell distribution within tissue compartments no longer meets the needs of precise histological research in some scenarios. In practical case analysis, there is often a need to analyze infiltrating cells within a defined range around the certain tissue types or certain cell types. For example, as shown in the figure below, it illustrates the analysis of immune cells infiltrating within a specific distance range around the tumor tissue. The figure shows the distance ranges calculated by the PWSA platform: 0-25μm (red pseudocolor), 25-50μm (yellow pseudocolor), and 50-75μm (purple pseudocolor) from the tumor area. Based on this, PWSA further identifies and tallies the number of all phenotypic (type) cells within each range.