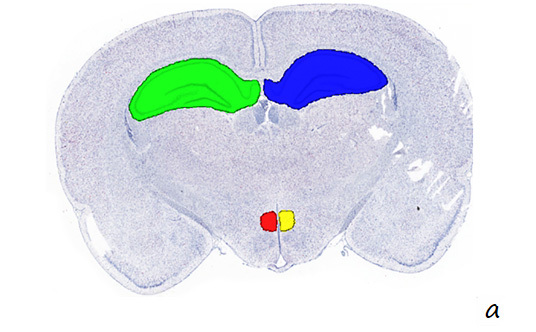
a. After RNA ISH detection (coronal section of rat brain), the corresponding pathological area was circled
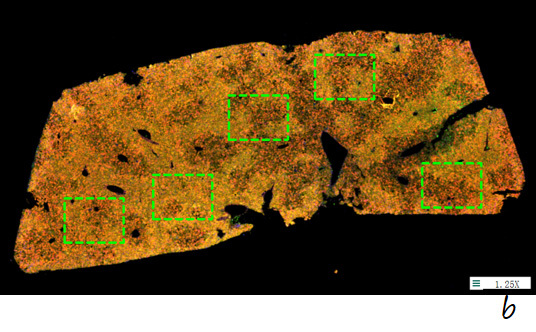
b. After RNA ISH detection (liver tissue), the ROI region was circled


RNA in situ hybridization (RNA ISH) is a technique to detect the expression and localization of specific RNAs at the tissue or cell level. It uses labeled nucleic acid probes to hybridize specifically with the RNA to be detected, and determines the location and abundance of RNA by detecting markers, which can be used in research fields such as gene expression and disease diagnosis, with accurate localization and can be combined with morphological analysis. The RNAscope technology developed by ACD is a new generation of RNA in situ hybridization technology, which has obvious advantages over traditional RNA in situ hybridization technology.
By introducing Visiopharm's leading image analysis artificial intelligence algorithm, Finovicam has generated the "Pheno whole slide analysis (PWSA) platform", which can analyze the scanned images after RNA ISH staining and mine the rich data information of the images.
|
The name of the analysis |
Analyze the content |
|
|
Pathological annotation |
Pathological zoning |
In the scan image, the pathological area is divided |
|
ROI regionalization |
There is a need to divide multiple ROI regions in a single slice |
|
a. After RNA ISH detection (coronal section of rat brain), the corresponding pathological area was circled
b. After RNA ISH detection (liver tissue), the ROI region was circled
|
The name of the analysis |
Analyze the content |
|
|
Positive RNA signal recognition (excluding nuclei) |
RNA ISH single-target positive RNA signal recognition (excluding nucleus) |
Identify positive RNA signals within ROI/circle/whole slice regions and perform counting, area counting, and density analysis of signal points |
|
RNA ISH dual-target positive RNA signal recognition (excluding nucleus) |
||
|
RNA ISH Three-Target Positive RNA Signal Recognition (excluding nucleus) |
||
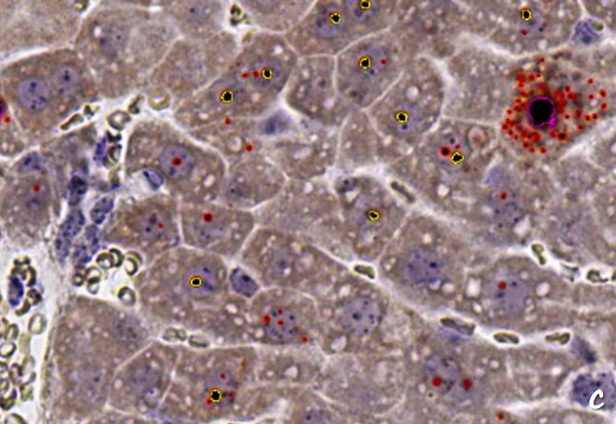
c. Identify all positive RNA signal points in the RNA ISH detection result graph, divided into red (<1.5 μm2), yellow (1.5 μm2- 5 μm2), pink (≥5 μm2) according to the area of the positive RNA signal points
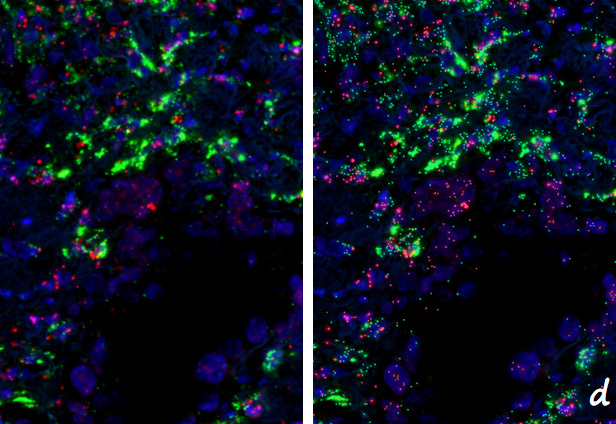
d. Identification of all positive RNA signal points in the image of the RNA ISH assay result (left) (right, tricolor pseudocolor marking)
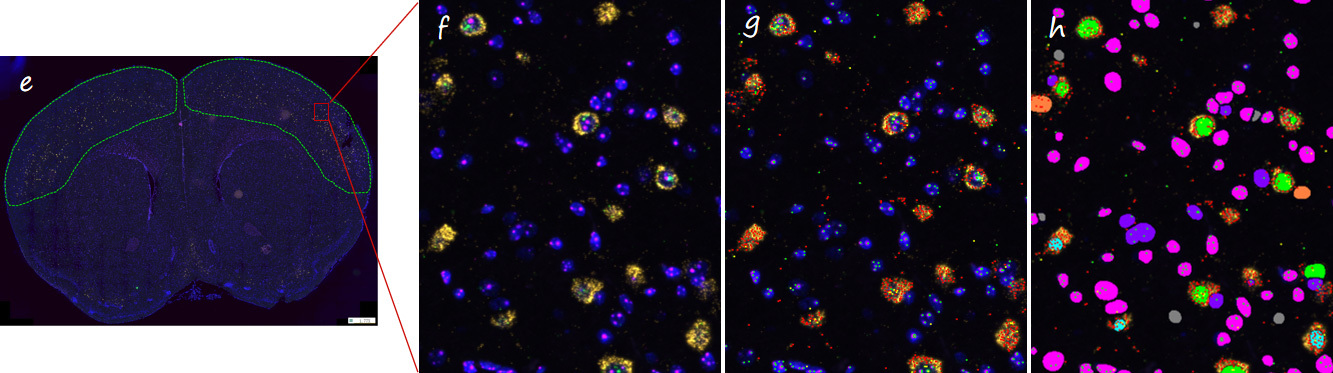
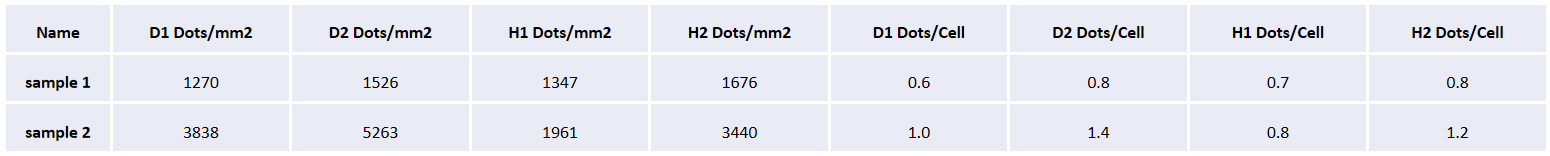
Caption: Detection of cerebral cortex RNA expression in coronal sections of mouse brain.
Figure f shows a partial enlarged picture of the scanned part of the detection result (40x, yellow, pink and green signal points are the positive signals of three different RNA probes, respectively); Figure g shows all positive RNA signal points in the identified f-panel; Figure h shows all types of RNA-positive cells identified in the area of figure f.
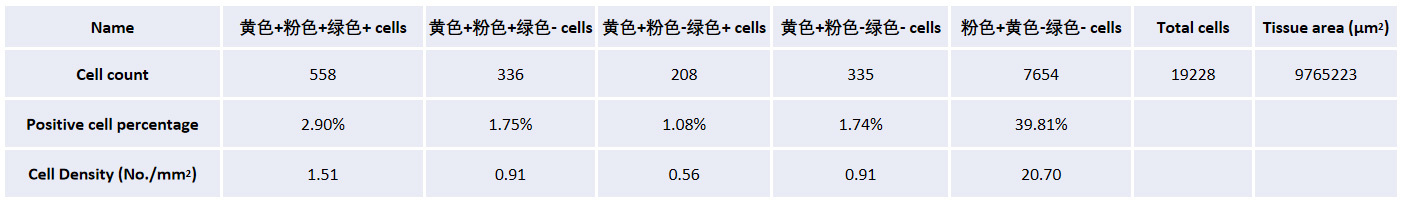
The table shows the tissue area of the cerebral cortex on both sides, the total number of cells, the number of cells labeled with different RNA combinations, the positive rate, and the cell density in each sample.
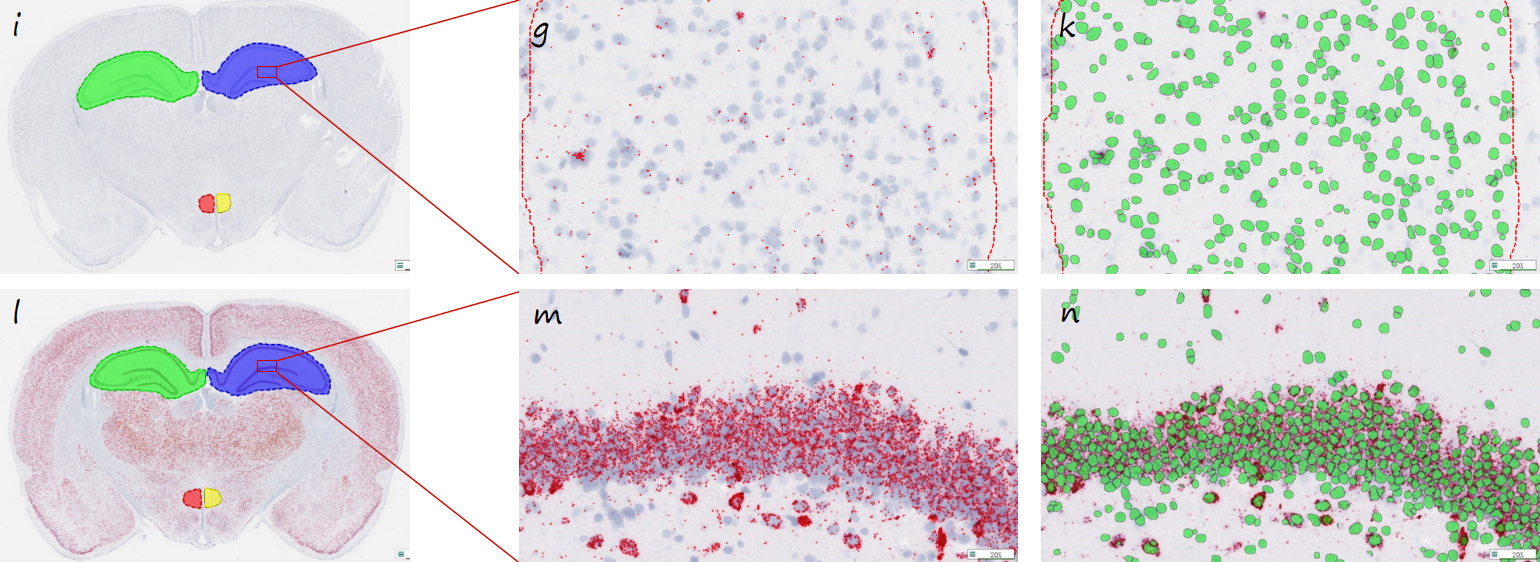
Note: The transcriptional differences between the hippocampus and substantia nigra regions of Rn-Crem in the control group (i) and the experimental group (l) were detected in coronal sections of the rat brain (the red signal points in the i and l figures are the positive signal of the RNA).
Figures g and m are all positive RNA signal points in the identified detection result pictures (red pseudocolor marking); Figures k and n are identified for all the cells.
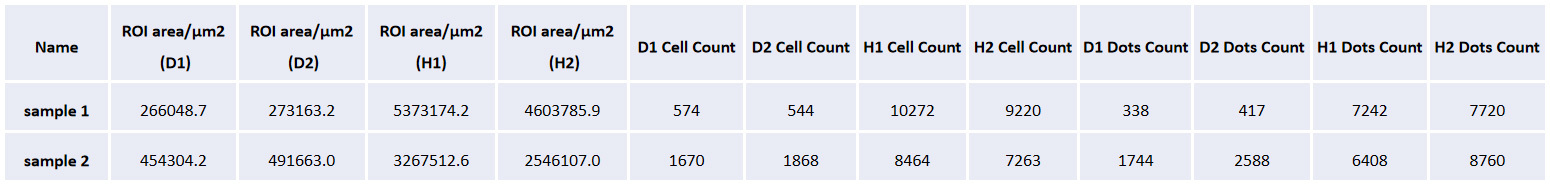
The tissue area, number of cells, number of RNA positive signals, density of signal spots, and average number of RNA signal points per cell are given in each rat sample.
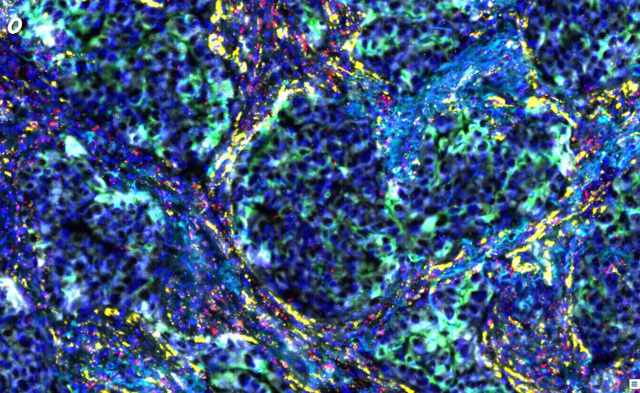
Caption: RNAscope (pink, red, and yellow fluorescein labeled three RNA signals: marker 4, 5, 6) + mIHC/mIF (smoke blue, green, and white fluorescein labeled three protein signals: marker 1, 2, and 3) were performed in human lung cancer samples, and the data analysis of the whole scans was performed.
Fig. o shows a region of the original scan image (20x) of the whole section;
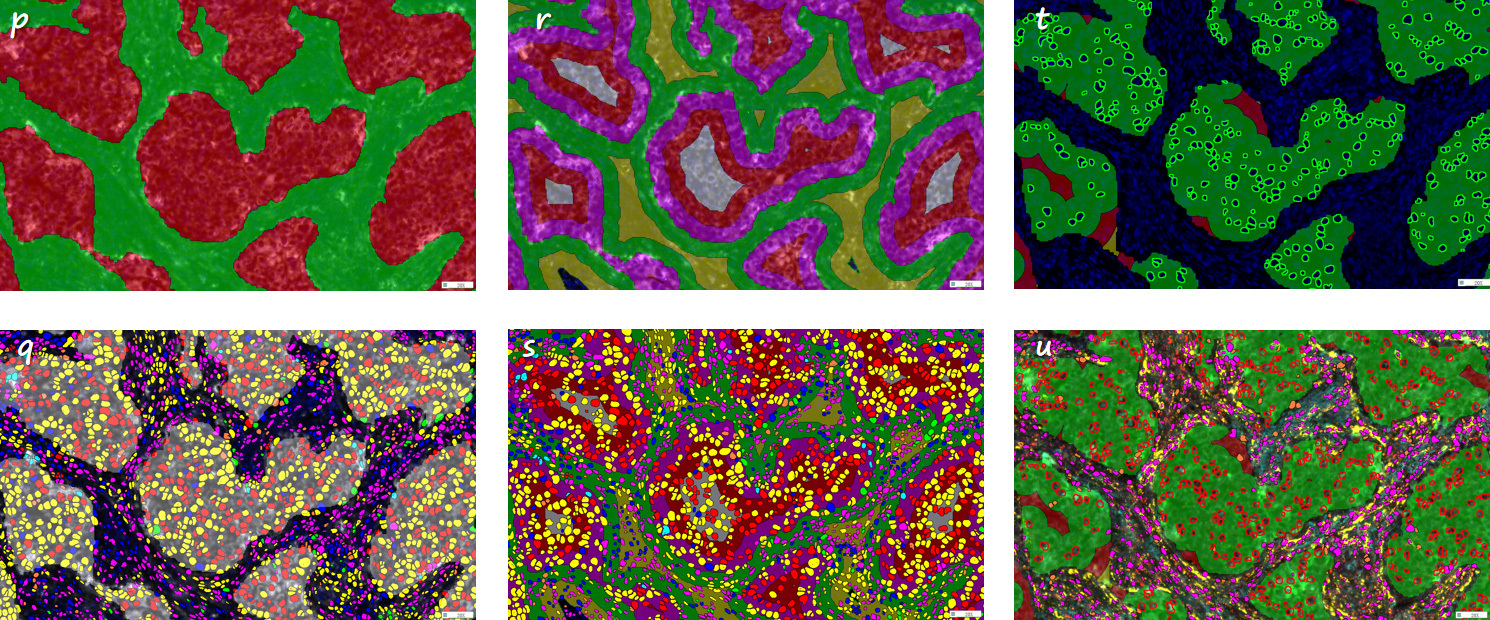
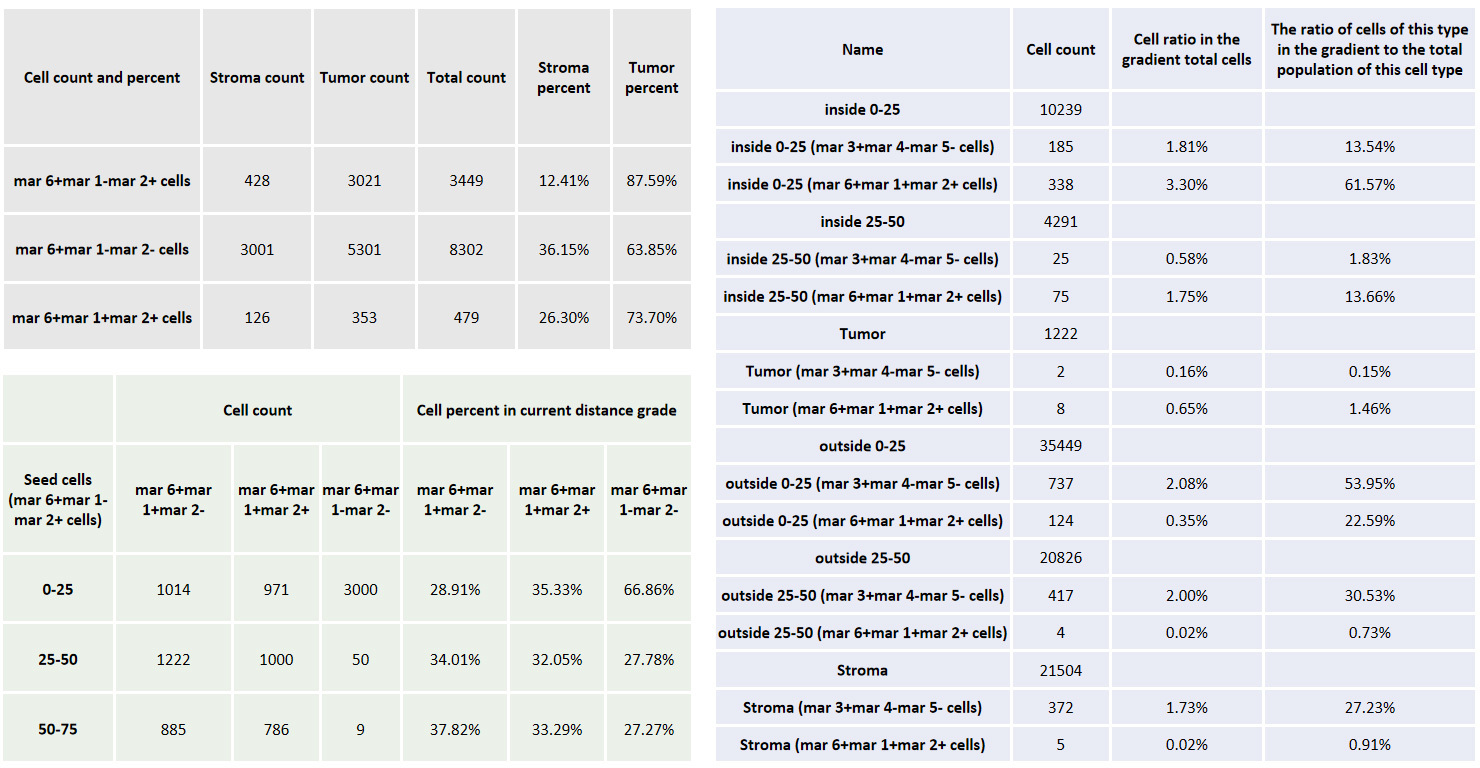
Figures P and Q show the identification of tumor parenchyma and tumor stromal regions, as well as the identification of different types of positive cells in tumor parenchyma and stroma (see the gray area in the table for analysis results).
Figures R and S are the identification of 0-25 μm (pink pseudo-color), 25-50 μm (red pseudo-color), 0-25 μm (green pseudo-color), 25-50 μm (yellow pseudo-color) and internal tumor tissue (white pseudo-color) outside the tumor tissue boundary, as well as the identification of specific marker combinations of cells in different recognition regions (see the blue area section in the table for analysis results).
Figures T and U are the identification of a certain class of positive cells of interest in this study, and the tissue regions in the three gradient ranges of 0-25 μm, 25-50 μm, and 50-75 μm around these cells in the tumor parenchymal region are labeled as green, red, and yellow pseudocolors, as well as the identification of other specific marker combinations within these three gradients (see the green area section of the table for analysis results).
Floor 3, Unit 1, Building 15, Jiajie Box Enterprise Exchange, Daxing District, Beijing
Official public number two-dimensional code


